
Unifying Reporting Data
Barracuda Networks offers cloud-first security solutions to protect email, networks, applications, and data from cyber threats. By using their cybersecurity products, organizations can collect and utilize data to enhance their security posture. To provide customers with a comprehensive view of their security status, I proposed developing a reporting system that covers all security vectors and gives a 360-degree overview.
Role
Lead Product Designer
Functions
Research, Interaction, Visual Design, Prototyping, Testing
Time
3 weeks
Understanding Customer Problems
I needed to understand the current perceptions and needs around our pre-existing reporting solutions. This would inform my design decisions and provide a starting point for defining success.
Method
Qualitative Interview
Particpants
9
Findings
- “We want to inform our users how attackers impersonate our people so they can identify attacks.”
- “We’ve been asked [by executives] to get an overall security posture report.”
- “Where can I schedule a report?”
- “You can tell then that this account (pointing to the top 1 attacked user) has a lot of attacks. And then you start wondering why this person is getting a bunch of attacks.”
- “I come in, and I go over the reports [referring to dashboards] and see if something is going on that we need to take a look at.”
- “What do you mean by reports? The graphs in the dashboard?”
Insights
- Customers don’t think we have reports – IT admins refer to dashboards when we ask how useful they find the reporting page.
- Users need reports with granular data to make decisions – IT admins value the data they can see in reports.
- Flexibility and control are most important for our customers – Users also value flexibility in the amount of data they can see in reports.
Use Cases
- IT Admins – View relevant, timely & actionable data to perform daily tasks.
- IT Managers – Track system activity and IT productivity.
- Upper management & MSP – Demonstrate Barracuda product value.
Auditing the Current Solution
The product portfolio offered multiple options to extract and display data across various security solutions. However, this experience needed to be more cohesive for customers who used multiple products.

Brainstorming
Customers needed a solution that could meet their diverse requirements for using product data. This involved examining all the product offerings and creating a versatile and expandable solution that could be integrated into any product.

Data reporting that is tailored to the users' needs

Dashboard
What's happening right now?
- Reflecting the current state of the system
- Showing what needs the IT admin’s attention
- Allow users to configure their dashboard by taking charts from reports
Report Builder
What happened historically?
- Digging into the organization’s cybersecurity trends
- Reporting what the system did to keep the organization safe
- Allow users to save their search queries, filters, and more.
Report Scheduler
What do I need to watch on the future?
- Maintaining visibility on reports that are scheduled
- Providing unified reports with proper labeling and branding
- Allow users to save their search queries, filters, and more
Report Builder (Phase 1)
Our users had an urgent requirement to create custom reports with flexibility. Starting with the report builder was a wise decision as it was an essential element to deliver the solutions our customers were looking for.
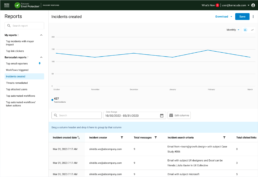

Structure
- Pre-created reports
- Ability to save custom reports
- Data visualizations
- Raw datatable view

Datatable
- Searching
- Filtering
- Sorting
- Column picker
- Stick columns
- Row grouping
Scheduled reports (Phase 2)
Users prefer spending minimal time in the product UI and only log in when necessary for security and monitoring. A comprehensive mechanism to send relevant data at regular intervals will provide a regular cadence to compare and monitor data. Reports sent out will give regular benchmarks for informed decisions and monitoring ROI and security posture.

List of scheduled reports
- View details
- Schedule new
- Edit
- Delete

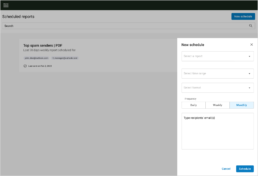
Schedule a report
- Type of report
- Time range of report
- Format of report
- Frequency
- Recipients

Reports received through email
- PDF attachment
- CSV attachment
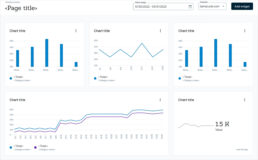
Dashboard (Phase 3)
A customizable dashboard would allow our users to quickly comprehend what is important to them in the moment.
Adding new dashboard widgets

Customizing the dashboard’s appearance and data is crucial for our customers’ efficiency.
- Add default reports
- Add custom-created reports
- Customize size of widget
Mechanisms allowing direct interaction with widgets in the dashboard would enable easier customization and more efficient data analysis.
Inline Controls

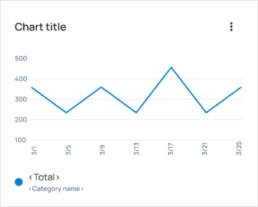
Visualizations
Bar Charts
Distribution/Comparison

Line charts
Represent data over time
Stats/Trends
Track metrics for data points/goals

Release & Future Plans
Phase 1’s report builder was the first portion of the unified reporting system to be released to customers and had an overall positive reception. I created a feedback program with a set of beta customers to get continuous feedback on their usage.
Feedback
Feedback was from a select group of beta test customers.
- Difficulty selecting standard date ranges (ex., 7 days) as specific dates had to be chosen every time.
- Dark mode version to reduce eye strain
- Theming support to control visualization colors
- Ability to choose which visualization could be used for the data
- Share custom reports with other people
Future Considerations
- More visualization choices
- Visualization color palette
- Live data feedback
- Dashboard drill-downs